Chapter 26. Feature Importance and Prediction Limits
A practical discussion of feature importance, permutation importance, partial dependence plots, and the limits of machine learning for causal interpretation.
Chapter purpose
Machine learning models can often predict outcomes accurately, but prediction alone does not tell us why those outcomes occur.
In economics, researchers usually want more than prediction. They want to understand which variables matter, how they matter, and whether relationships reflect genuine economic mechanisms.
This chapter examines feature importance and explains why prediction should not be confused with causation.
Applied question
Which product characteristics contribute most to predicting milk prices?
Key idea
Machine learning models can identify variables that improve prediction. However, variables that are important for prediction are not necessarily causes of the outcome.
A variable can be useful for prediction without causing the outcome.
26.1 What is feature importance?
Feature importance measures the contribution of a variable to predictive performance. When a model uses several predictors, some variables may help prediction more than others.
For example, a Random Forest predicting milk prices may use volume, brand, fat content, package type, and freshness. Feature importance attempts to quantify how much each variable helps improve prediction.
Variable
Importance
Volume
0.48
Brand
0.27
Fat
0.15
Package
0.07
Freshness
0.03
Higher importance values indicate that a variable contributes more to prediction. They do not indicate economic significance or causality.
26.2 Feature importance in Random Forests
Random Forests naturally generate importance measures. The algorithm evaluates how much each variable improves prediction across many trees.
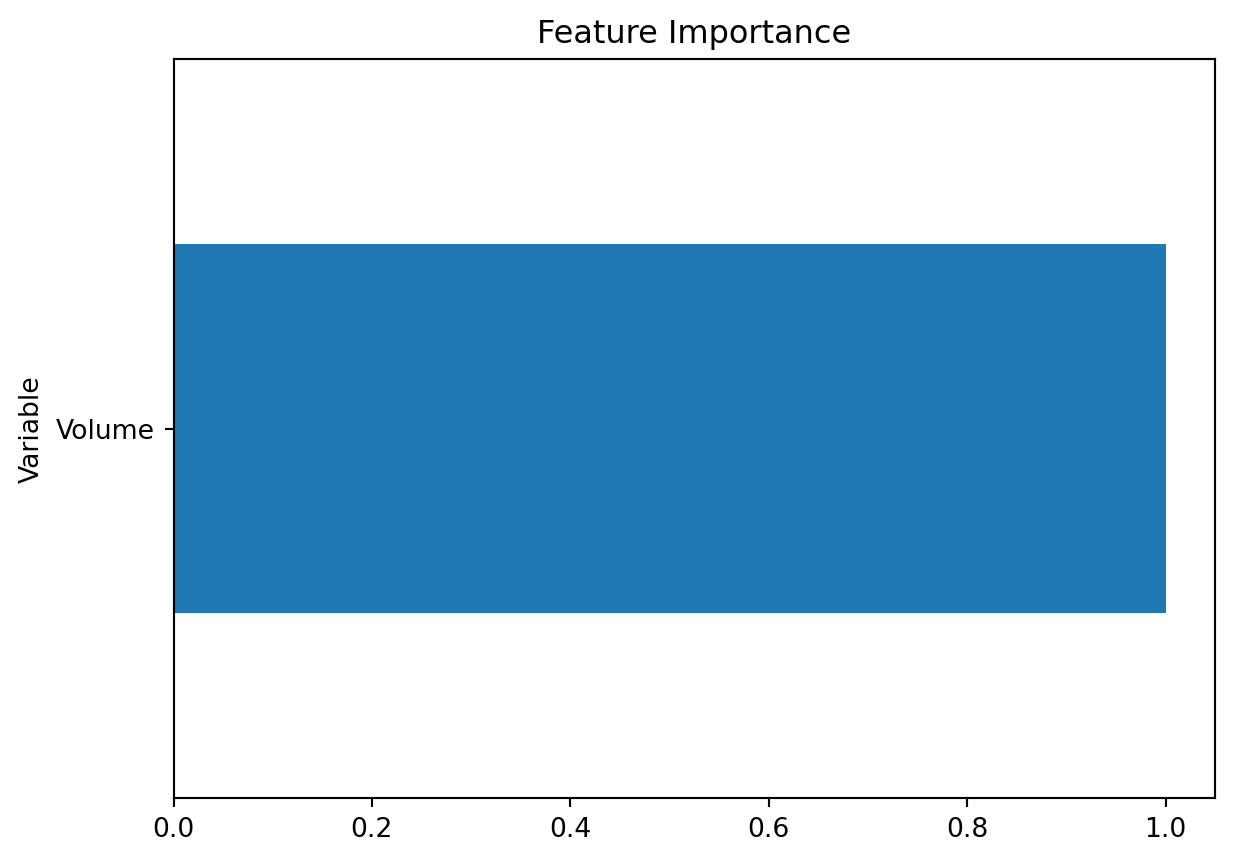
import matplotlib.pyplot as pltimportance.sort_values("Importance").plot( x="Variable", y="Importance", kind="barh", legend=False)plt.title("Feature Importance")plt.show()
Interpretation
The graph ranks predictors according to their contribution to model performance. Researchers can use this ranking as a starting point for further investigation.
26.3 Permutation importance
Standard importance measures can sometimes be misleading. Permutation importance provides an alternative.
For each variable:
Randomly shuffle its values.
Recalculate prediction accuracy.
Measure how much accuracy declines.
If prediction accuracy deteriorates sharply, the variable was important.
Permutation importance asks what happens when the model loses useful information from one variable. If accuracy falls sharply, the variable was important for prediction.
26.4 Partial dependence plots
Feature importance tells us which variables matter for prediction. Partial dependence plots help us understand how predictions change as a variable changes.
For example:
How does predicted price change as volume increases?
How does predicted price change across package types?
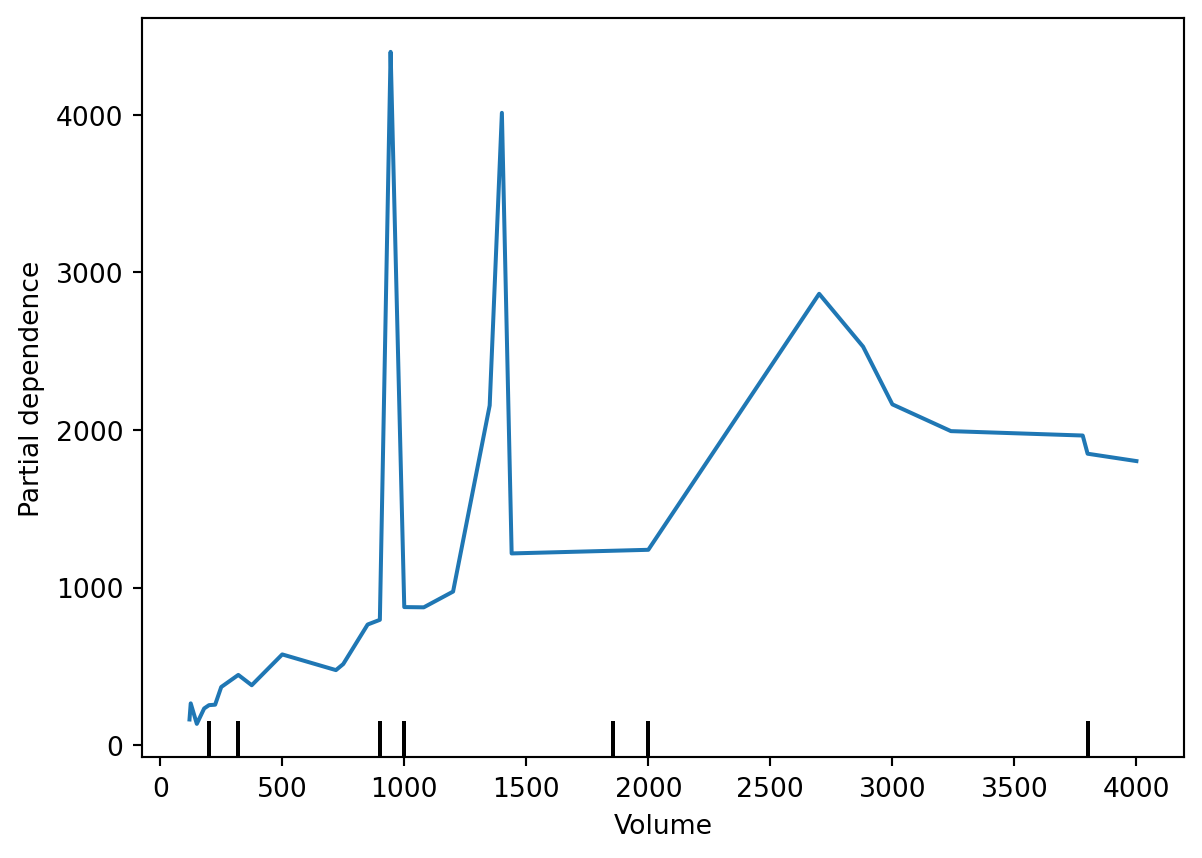
from sklearn.inspection import PartialDependenceDisplayPartialDependenceDisplay.from_estimator( forest_model, X_train, ["Volume"])
Interpretation
Partial dependence plots improve transparency. They help researchers understand how a machine learning model behaves. However, they still do not establish causal relationships.
26.5 Why prediction is not causation
Suppose a model finds that premium brands are important predictors of price. Can we conclude that becoming a premium brand causes higher prices?
Not necessarily.
Premium brands may differ in quality, marketing, consumer preferences, distribution, and product positioning. The model shows predictive value, not a clean causal effect.
A classic example is ice cream sales and drowning incidents. Both may increase during hot weather. Ice cream sales may help predict drowning incidents, but ice cream sales do not cause drowning.
26.6 What machine learning can do
Machine learning is useful when the objective is prediction. Examples include forecasting food prices, predicting crop yields, demand forecasting, credit scoring, and consumer behavior prediction.
Its strengths include handling large datasets, capturing nonlinear relationships, detecting complex interactions, and often improving prediction.
26.7 What machine learning cannot automatically do
Machine learning does not automatically solve fundamental econometric problems, such as omitted variable bias, endogeneity, reverse causality, measurement error, and selection bias.
A model may predict agricultural exports accurately, but this does not mean it identifies the causal effect of trade agreements on exports. Causal analysis requires research design, theory, and appropriate econometric methods.
26.8 Responsible use in economics
Machine learning should be viewed as a complement to econometrics, not a replacement.
A practical workflow is:
Use economic theory to formulate the question.
Use regression models to estimate interpretable relationships.
Use machine learning models to improve prediction.
Compare results and evaluate robustness.
This combines the strengths of both traditions.
Bringing Part V together
Chapter
Main theme
22
Train-test split and prediction
23
Regression versus machine learning
24
Decision Trees and Random Forests
25
XGBoost and model comparison
26
Feature importance and prediction limits
Together, these chapters introduce predictive analytics while maintaining the econometric focus of the course.
WarningCommon mistake
Do not interpret feature importance as evidence of causality. Feature importance identifies variables that improve prediction. Causal inference requires theory, research design, and econometric methods.
Important predictors are not necessarily important causes.
Permutation importance provides an alternative importance measure.
Partial dependence plots help explain model behavior.
Machine learning identifies patterns, not causal mechanisms.
Econometrics and machine learning are complementary tools.
Economic theory remains essential for empirical analysis.
Looking ahead
The next part of the course moves from prediction to research practice. Students will learn how to formulate research questions, organize data, write methodology sections, present empirical results, and prepare a complete empirical article.